Evaluations for the amateur radio logbook - diagrams
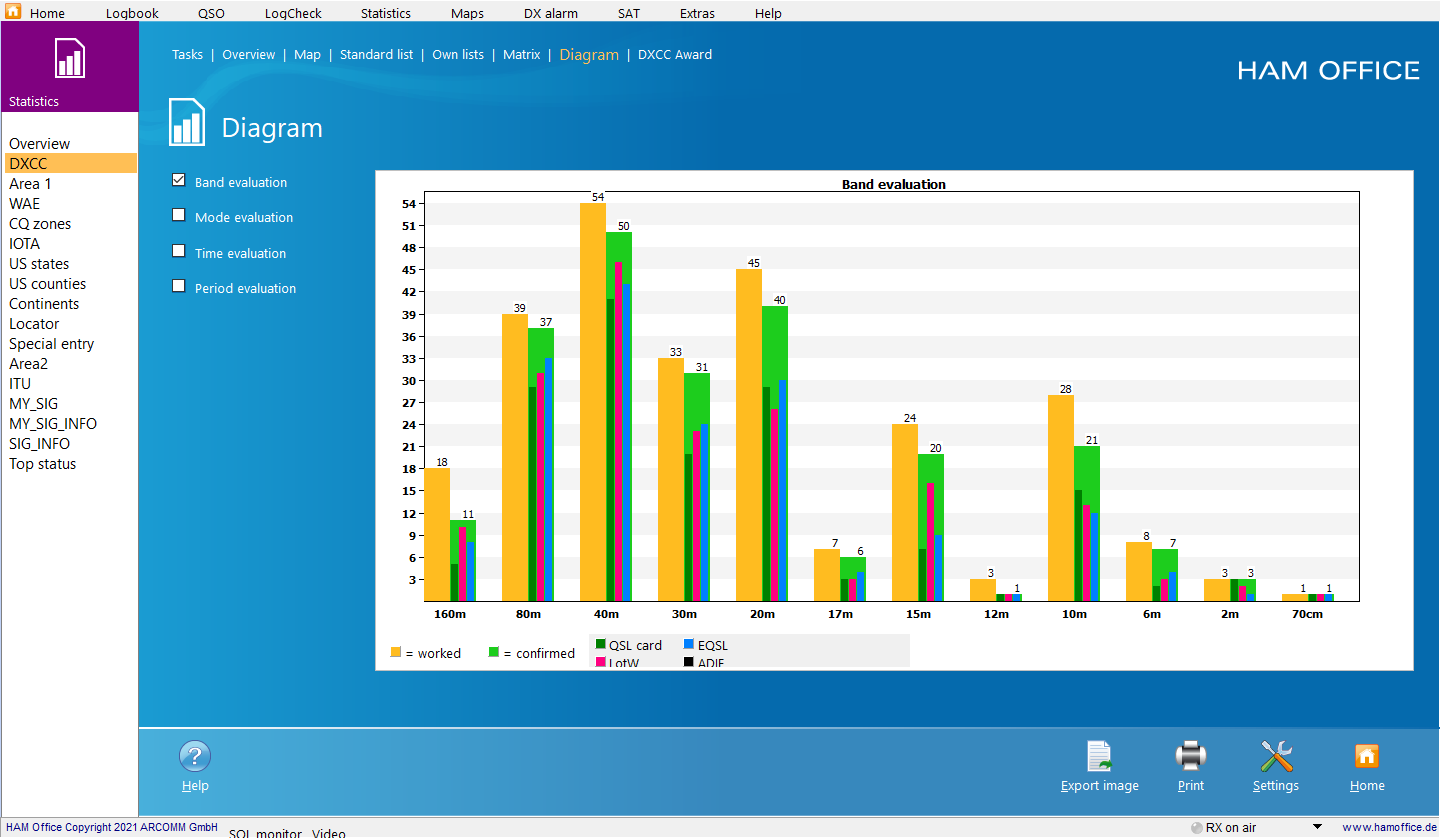
Pic above: Band evaluation diagram
Display of the worked and confirmed QSO or DXCC etc. per band.
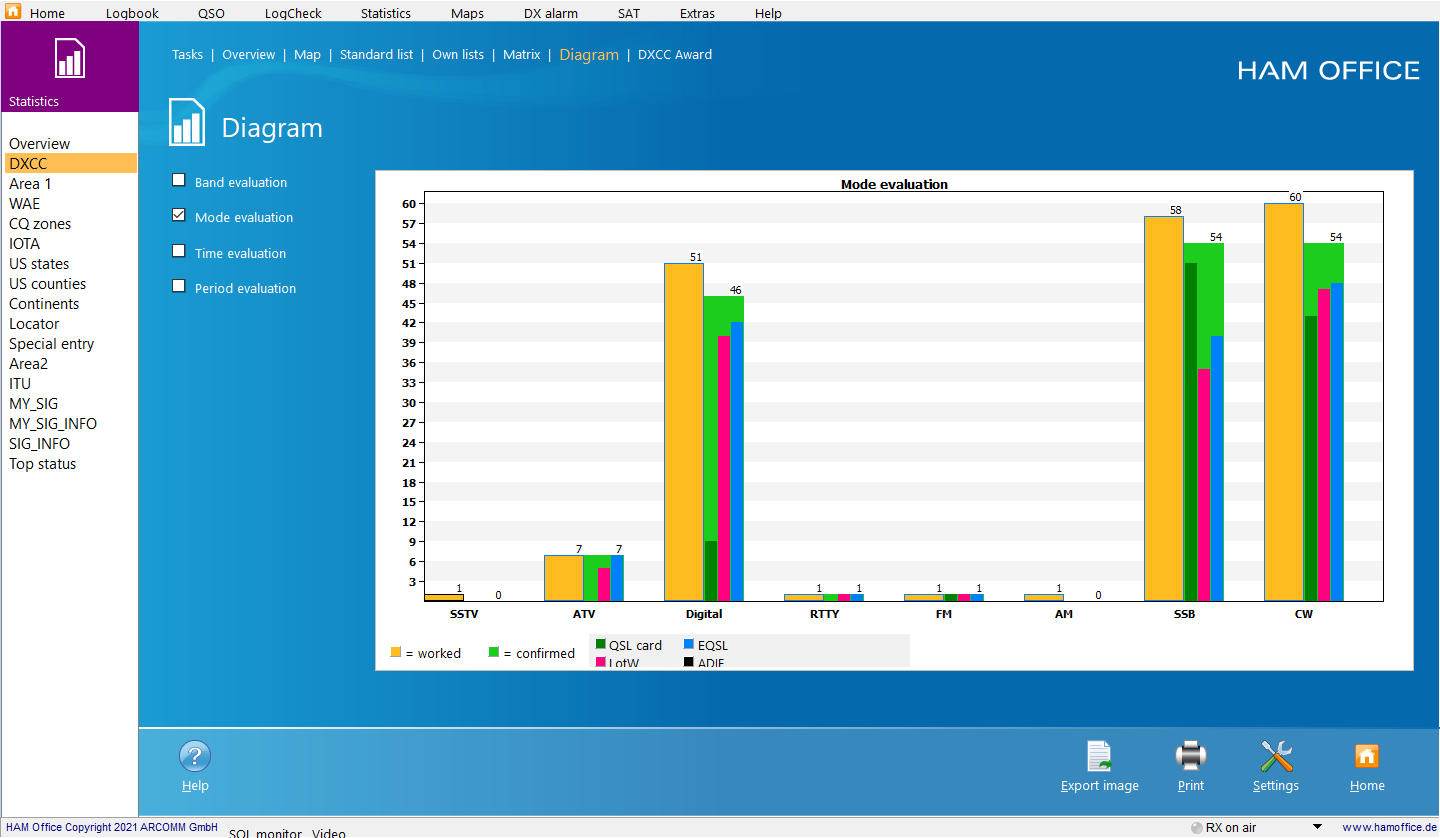
Pic above: Diagram of mode evaluation
Display of the worked and confirmed QSO or DXCC etc. per operation mode
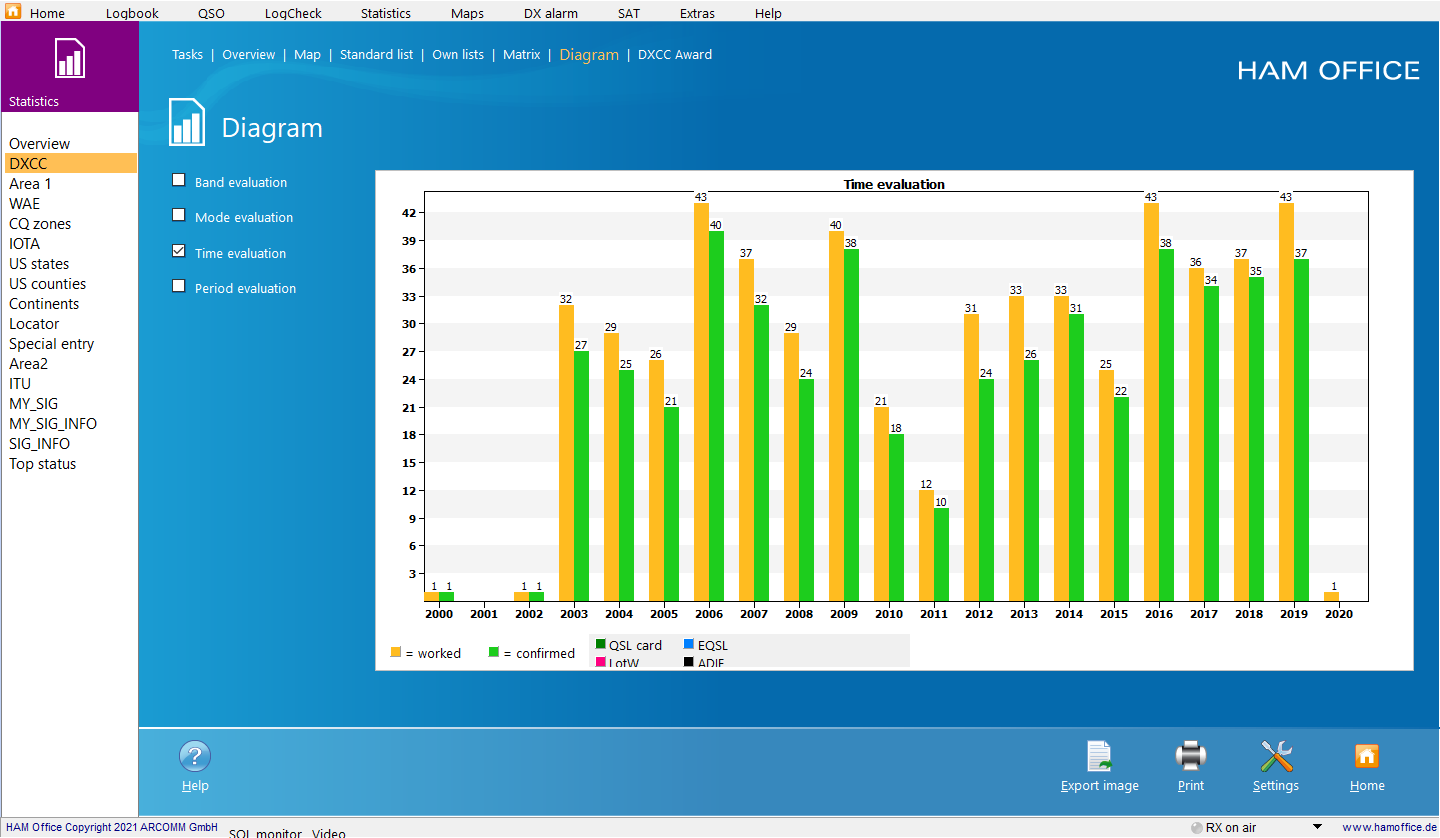
Pic above: Diagram time evaluation
Display of the worked and confirmed QSO or DXCC etc. per year/quarter/month/week/day.
Pic above: Diagram of period evaluation
Display of the worked and confirmed QSO or DXCC etc. at certain times, days of the week (picture), months or quarters.
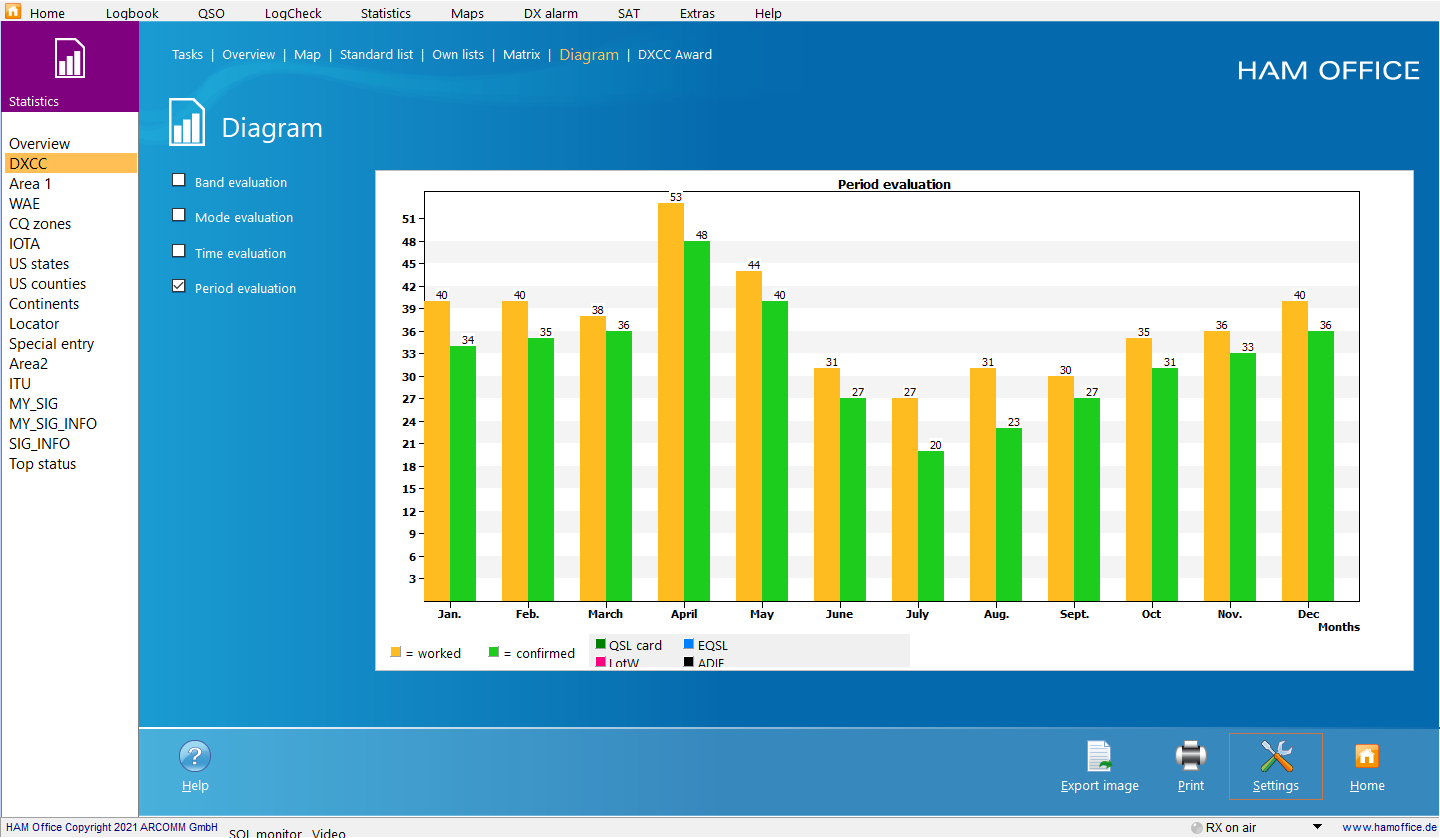
Pic above: Diagram of period evaluation
Display of the worked and confirmed QSO or DXCC etc. at certain times, days of the week, months (picture) or quarters.
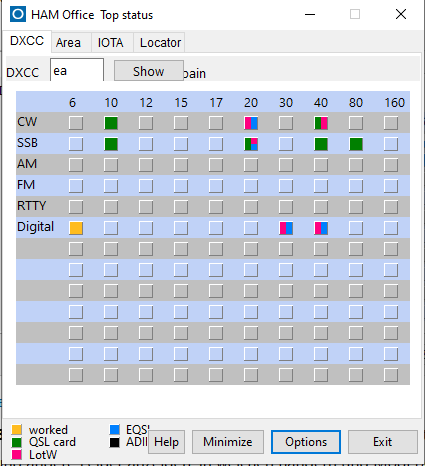
Pic above:In many parts of the program you will find these statistics tables, which show for specific DXCC, Area and other fields in which bands and modes confirmed or worked QSOs exist. These tables offer an extremely quick orientation already during the QSO entry.


